|
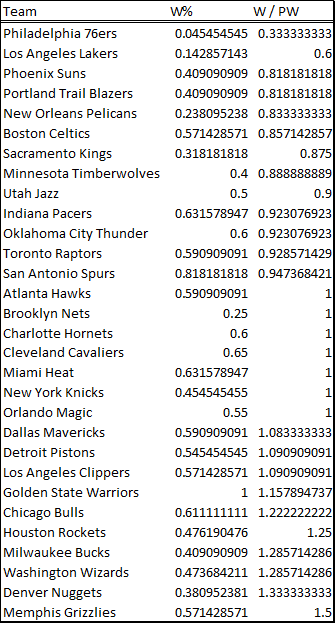
One of the simplest, and thus most confusing ways of projecting wins is the pythagorean wins calculation. This is purely based off of points scored verse allowed. For those curious it is calculated with this equation. G * (Tm PTS14 / (Tm PTS14 + Opp PTS14)) This over the course of a season does a really good job at predicting the win loss record for teams with an error of around 3 wins. This is a fairly simple equation obviously, but I'm curious if a comparison of actual wins to projected wins can tell us anything. Currently, 7 teams projected wins is the exact same of their actual record, 10 have won more than projected and, 13 are worse. **Keep in mind over the course of a full season there is an understood error of +/- 3 games. ** With the above caveat in mind I'm going to make some declarations based on this data.
Next, I took a look at the teams situated right at one. Nothing stands out. We have a large spread of W% among these teams (0.25 - 0.65) From there I moved on to considering if this was showing us teams that are good at executing late in games or in close games. The presence of DEN, MIL, WAS, and HOU put a halt to that theory.
Next, I took a flyer and looked at average team age compared to W/PW. Nothing. Now I'm a bit frustrated. I'm having flashbacks to my first science fair and the teacher promising us that even if your hypothesis is wrong it doesn't mean the experiment is bad, and more importantly; you aren't dumb for having an incorrect hypotheses. I hope you weren't lying to me, Mr. Musgrave. Anyway, I feel like some conclusion has to be made. I'm going to ignore everything I've said so far and claim teams <1 are underperforming and will increase their winning percentage as the season progresses while the teams >1 have overperformed. Their winning ways will slow as the season progresses. Lord, let's hope this one shot conclusion is accurate considering I'd like nearly every team >1 to do worse than they currently are. Yeah, I'm a hater. |
AuthorArchives
November 2017
Categories
All
|
 RSS Feed
